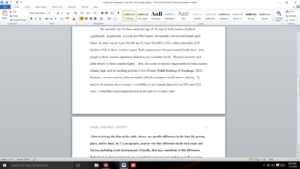
Disparities Between Cook and Will County of Illinois
Disparities Between Cook and Will County of Illinois
| Cook County
2015 |
Will County
2015 |
Cook County
2020 |
Will County 2020 | |
| Population size | Population est. as of 2015 (CB)
5,238, 216 |
Population est. as of 2015 (CB)
687,263 |
Population est. as of 2020 (CB)
5,150, 233 |
Population est. as of 2020 (CB)
690,743 |
| Length of Life | ||||
| Premature Deaths
Age 75 per 100,000 |
340.4 per 100,000 | 278.2 per 100,00
Race/Ethnicity data was not provided during this time |
340 per 100,000
AIAN- 190 Asian- 140 Black- 600 Hispanic- 220 White- 270 |
290 per 100,000
AIAN- N/A Asian- 120 Black- 390 Hispanic- 200 White- 300 |
| Infant Mortality | 7.6 per 1,000 live births
Race/Ethnicity data was not provided during this time |
6.8 per 1,000 live births | 7 per 1,000 live births
AIAN- N/A Asian- 5 per 1,000 Black- 13 per 1,000 Hispanic- 5 per 1,000 White- 4 per 1,000 |
5 per 1,000 live births
AIAN- N/A Asian- N/A Black- 12 per 1,000 Hispanic- 4 per 1,000 White- 4 per 1,000 |
| Child Mortality under age 18 | 64.4 per 100,000
Race/Ethnicity data was not provided during this time |
41.6 per 100,000
Race/Ethnicity data was not provided during this time |
60 per 100,000
AIAN- N/A Asian- 40 Black- 110 Hispanic- 40 White- 40 |
40 per 100,000
AIAN- N/A Asian- 20 Black- 90 Hispanic- 40 White- 30 |
| Quality of Life Indicators | ||||
| Poor/Fair health | 17% | 13% | 17% | 15% |
| Poor Mental health days | 3.5 per 30 days | 3.2 per 30 days | 3.7 per 30 days | 3.7 per 30 days |
| Low Birthweight | 9.1%
Race/Ethnicity data was not provided during this time |
7.6% | 9%
AIAN- 8% Asian- 9% Black- 14% Hispanic- 7% White- 7% |
8%
AIAN- N/A Asian- 8% Black- 13% Hispanic- 7% White- 7% |
| Health Behaviors | ||||
| Food Environment index | Limited access to health foods 2%
Food Insecurity 15% |
Limited access to health foods 6%
Food Insecurity10% |
Limited access to health foods 2%
Food Insecurity 12% |
Limited access to health foods 6%
Food Insecurity 7% |
| Physical inactivity | 21% | 23% | 21% | 23% |
| Access to exercise opportunities | 99% | 96% | 99% | 97% |
| Adult obesity | 25% | 29% | 28% | 32% |
| Adult smoking | 18% | 18% | 14% | 13% |
| Clinical Care | ||||
| Primary care physicians | 1,088:1 | 1,967:1 | 1,070:1 | 1,830:1 |
| Dentists | 1,250:1 | 1,997:1 | 1,100:1 | 1,820:1 |
| Mental health providers | 576:1 | 1,366:1 | 370:1 | 880:1 |
| Mammography screening | 62.4%
Race/Ethnicity data was not provided during this time |
64.4%
Race/Ethnicity data was not provided during this time |
40%
AIAN- 31% Asian- 35% Black- 38% Hispanic- 37% White- 42% |
42%
AIAN- N/A Asian- 36% Black- 44% Hispanic- 35% White- 43% |
| Social and Economic Factors | ||||
| Suicides | N/A | N/A | 8 per 100,000
AIAN- N/A Asain-5 per 100,000 Black- 6 per 100,000 Hispanic- 5 per 100,000 White- 11 per 100,000 |
11 per 100,000
AIAN- N/A Asian- N/A Black- 5 per 100,000 Hispanic- 6 per 100,000 White- 13 per 100,000 |
| Children in Poverty | 26%
Race/Ethnicity data was not provided during this time |
12%
Race/Ethnicity data was not provided during this time |
19%
AIAN- 21% Asian- 12% Black- 38% Hispanic- 25% White- 8% |
9%
AIAN- N/A Asian- 6% Black- 21% Hispanic- 18% White- 5% |
| Injury death | 46 per 100,000
Race/Ethnicity data was not provided during this time |
39 per 100,000
Race/Ethnicity data was not provided during this time |
60 per 100,000
AIAN- 21 per 100,000 Asian- 17 per 100,000 Black- 104 per 100,000 Hispanic- 36 per 100,000 White- 54 per 100,000 |
40 per 100,000
AIAN- N/A Asian- 17 per 100,000 Black- 56 per 100,000 Hispanic- 30 per 100,000 White- 56 per 100,000 |
| Physical Environment | ||||
| Air pollution (particulate matteravg. 2.5 ) | 13.1 | 13.1 | 15.0 | 13.3 |
| Severe housing problems | 24% | 16% | 22%
Cost Burden 19% Overcrowding 4% Inadequate Facilities 1% |
15%
Cost Burden 13% Overcrowding 2% Inadequate Facilities 1% |
| Driving alone to work | 63% | 82% | 61%
AIAN- 58% Asian- 55% Black- 59% Hispanic- 63% White- 62% |
84%
AIAN- N/A Asian-77% Black- 81% Hispanic- 80% White- 85% |
| Long commute – driving alone to work | 49% | 50% | 53% | 50% |
Reference citation(s)
Cook County Public Health (n.d.). Retrieved June 5, 2021
https://
County Health Ranking Roadmaps (n.d.). Retrieved June 5, 2021, from
https://www.
County Health Ranking Roadmaps (n.d.). Retrieved May 24, 2021, from
Quick facts.(n.d.). Retrieved June 6, 2021, from
https://data.census.gov/
Quick facts.(n.d.). Retrieved May 24, 2021, from
https://www.census.gov/
Will County Health (n.d.). Retrieved May 24, 2021, from
https://willcountyhealth.org/
Will County Health Annual reports (n.d.). Retrieved May 24, 2021, from
https://willcountyhealth.org/
Part 2In one paragraph summarize data and identifytrends from the data in your table (across person, place and time variables). What further information/data would you like to have to analyze these trends?
Part 3After reviewing the data in the table, choose one specific difference in the data (by person, place and/or time). In 1-2 paragraphs, analyze why this difference in the data exists and factors, including social determinants of health, that may contribute to this difference. Refer back to short assignment 1 as needed to support your analysis as well as review related literature.
Requirements: 3 Paragraph
Answer previewFrom the analysis, one identifiable difference in the data is the rate of premature death between Cook and Will counties. Considering its population, will the county population has a higher rate of premature deaths. The higher rate of premature in this county is caused by numerous factors, including a higher poverty rate, few numbers of health professionals, lifestyle, and environment (Quick facts.n.d.). In particular, lifestyle is one of the causes of premature deaths in Will County. The county records a high rate of inactivity and adult obesity which are major causes of chronic illnesses and sometimes premature deaths. Also, inadequate health providers may another cause of premature death in the county.
[589 Words]
Disparities Between Cook and Will County of Illinois